
Prolific Earth Sciences is excited to announce the release of microBIOMETER® PRO. This extensive update has been three years in the making and features improved precision, increased consistency between phones, advanced nutrient metrics and sample geolocating. Please update your microBIOMETER® Reader app to 3.8.6 to access the PRO version.
What’s NEW!
• Test card. We redesigned the test card to reduce variance in results between phone models and better adjust for different lighting.
• Results. The results are now expressed as microbial biomass instead of microbial carbon.
• Moisture: We have changed the moisture assumption in our algorithm from 40% to 20% which is more in line with average soils. We also added a feature to allow users to adjust the moisture assumption to reflect soils with moisture contents closer to 10% or 30%. Moisture assumption for compost testing remains at 40%
• Geolocation: This new feature allows users to save the location where their sample was collected and perform the test at a later time while keeping the recorded sample location.
• Advanced Nutrient Metrics: As an understanding of how microbes contribute to nutrient availability increases, we have added calculated metrics to help users understand how their soil microbes are contributing to nitrogen and carbon stores in the soil. These are results extrapolated from microBIOMETER® results and the calculation and assumptions are detailed in the app informational pop-ups and our website FAQs.
• Soil and Compost: The PRO version will test both soil and compost, however, will no longer support direct testing of compost tea or extract.

With the exception of the test cards, all the supplies as well as the instructions will remain the same whether using the Classic or PRO version. The updated app will prompt you to choose a version so you can still use the classic test cards. We will also be selling Classic cards in refills for the foreseeable future. However, all new Starter Kit purchases will now be the PRO version only and contain the new test cards. For customers with ongoing trials, you may want to continue with the Classic test cards to track changes based on historical benchmarked tests.
In the updated app, we have made significant changes to units, underlying assumptions, and calculations. Therefore, we encourage users to continue with one version within a study or experiment since comparing the absolute values of the two is difficult. We have always encouraged using microBIOMETER® as a benchmark test and to focus on the changes over time. We will continue to supply the microBIOMETER® Classic test cards so that ongoing studies and trials can continue. However, we strongly recommend using the PRO version for all new testing and studies.
We would like to thank all of our customers that have given us feedback over the years. Your comments, both good and bad, have helped us improve the microBIOMETER®. Please keep sharing! And as always, we appreciate your continued support.
 PADK is an NGO dedicated to building capacity in regenerative agriculture techniques and soil science research. Their main initiative and focus, the Tropical Agriculture Research and Training Station (TARTS), is in the small village of Ngotto, in the East Region of Cameroon. The company’s objectives are to:
• Produce highly biodynamic and performant soil amendments.
• Restart the microbial activity of tropical soils, increasing nutrient availability, and alleviating the pressures of chemical fertilizers and pesticides.
• Increase local small-holder farmers’ knowledge of soil ecology and provide them with tangible resources to improve and regenerate their farmland.
A variety of logistical factors impeded their workflow while utilizing microscopy in their labs. Sampling was infrequent and irregular, tracking the F: B progression was difficult, and correlating with climate data and environmental parameters was near impossible.
In early 2022, Founder, Mr. Edmond Nader, came across the microBIOMETER®. Since then, they have accelerated their R&D efforts, and their results have benefited from more consistent monitoring. The benefits they have discovered while using microBIOMETER®:
• Process samples, measure the F:B ratio, and record the results using the mobile app’s Data Capture functionality, in about 20 minutes. The data capture has been a very welcome surprise as its simple to follow the evolution of substrates tested with the database and share results.
• Correlate data from other experiments and compare against our microscopy results.
• Accurately track the shift from bacterial dominance (i.e. thermal phase) to fungal dominance in their composting efforts.
“The microBIOMETER® has been an invaluable tool. It has helped our organization to better document results and follow the evolution of our efforts. We have found results to be accurate against most of our microscopy verifications and we trust the results. We are eager to share our experience with this tool with others and promote its use in sub-Saharan Africa, tropical climates, and elsewhere. There are few useful field tests available, especially useful in such rural areas as we work, the microBIOMETER® has been a very welcome addition to our laboratory and field studies.”

Sales rep Brent taking a soil sample at one of the farms in West Texas
Leveraging microBIOMETER® for Increased Soil Health
Our customer Living Water has been utilizing microBIOMETER® to enhance their approach to sustainable farming and to refine their microbial treatments, ensuring they meet the specific needs of each farm.
Their innovative system integrates with the existing irrigation setup to distribute beneficial microbes effectively. With the help of microBIOMETER®’s soil testing, they are able to analyze microbial biomass and adjust the microbial mixes they provide each month, ensuring optimal soil health.
Key Benefits:
Living Water and microBIOMETER®’s collaboration is the result of their shared passion for soil health and their quest to transform farming with data-driven microbial management.
About Living Water: Living Water is a visionary agricultural technology company with a mission to redefine the way farmers approach soil health. Their flagship product is a subscription-based automated microbe bioreactor that seamlessly infuses essential nutrients into every irrigation cycle. Designed to deliver maximum efficiency with minimal labor, this innovative system eliminates the need for labor-intensive hauling, mixing, or application processes. Learn more at WeSaveSoil.

There are many soil tests on the market so it can be difficult for farmers to ascertain whether or not they’re choosing the right one. The truth is, there are pros and cons to every soil test. Therefore it boils down to finding which ones align best with your farming goals and which are easily and readily available to you without needing to stretch your resources too much.
Since microBIOMETER® is a relatively new soil test on the market, a lot of questions are raised on how this test is different from other commonly used soil indicators such as the Haney Soil Test and PLFA test. While all three are soil biological health tests, their methodologies are very different and the tests measure different parameters.
The microBIOMETER® is an on-site soil test that measures the microbial biomass and fungal to bacterial ratio of living and dormant bacteria and fungi. The test process works by measuring the color intensity of the microbial solution created and comparing the color to the test card comparator. This patented, colorimetric analysis process is generated through our microBIOMETER® Reader App and produces results within 25 minutes of starting the testing process. Test prices range from $13.50/sample to $6.75/sample. The low cost, rapid result detection, and on-site testing of living soil are what makes this test stand out against others. The microBIOMETER® has a slightly limited scope, however, as it’s only able to measure the overall biomass of fungi and bacteria. It does not differentiate between microbial species nor does it measure any other parameters.
The Haney Soil Test is a lab test that focuses on assessing a variety of soil parameters such as pH, microbial biomass, water extractable organic carbon and nitrogen, soil respiration, and inorganic plant available nutrients such as NPK. This test uses multiple methods in order to obtain results, including the Solvita CO2 Burst test to indicate soil microbial respiration and biomass, and the use of unique soil extracts to determine organic and inorganic nutrient availability. While this test offers a large array of soil parameters, there is controversy in the science community about using the Solvita CO2 Burst test methodology as a way of accurately predicting microbial biomass. This is because the soil is dried then rewetted to trigger a release of CO2 to measure microbial activity. Drying soil decreases microbial biomass, and while rewetting it will increase biomass again, it doesn’t necessarily repopulate back to the original microbial composition. The Haney Soil test is offered at several labs throughout the country and recommendations are included with results. Generally, this lab test costs about $50/sample and takes about 3-4 weeks to receive results.
The PLFA Soil Test is a lab-based technique that analyzes phospholipid fatty acids (PLFA), which are found in the cell membranes of living organisms, to determine an estimation of living microbial biomass, fungal to bacterial ratio, and to identify the general presence or absence of microbial functional groups in bacteria, fungi, and protozoa. For this test, labs first dry the soil overnight then use multiple solvents to extract fatty acids from the sample. Then, mass spectrometry is used to identify the sample’s microbial composition based on specific PLFA biomarkers. This testing process takes a few days to complete and generally costs about $60/sample depending on the lab. It is one of the most utilized testing methods since it gained popularity in the late 80’s. Since then, it was discovered that some of the PLFA biomarkers used for identification aren’t limited to one microbial group, therefore making it difficult to determine the accuracy of some results.
The value of each of these tests is to determine a baseline assessment of your soil health. The information obtained from any of these tests will help you gain a better and more rounded understanding of what’s happening in your soil.
 The microBIOMETER® was developed with the need in mind to deliver a device that could be manufactured very reasonably so that it could service the whole world. For over 50 years scientists have known that microbes are the best indicator of soil health. One of the common methods used for determining soil microbial biomass is the Chloroform Fumigation Extraction (CFE) test. However, being a costly lab-based test makes it an unattainable option for many. Another method that’s often used to assess soil microbial communities is microscopy. While microscopy is one of the best ways to assess soil microbes, microscopes can be expensive, are often too large and heavy to bring into the field, and are not necessarily easy to use or easily accessible for growers around the world. In 2014, Dr. Fitzpatrick began developing the microBIOMETER® to address these shortcomings.
The microBIOMETER® was designed to detect bacteria and fungi by their pigmentation on a specially designed membrane. An extraction powder was developed that contains different salts, which, combined with precise whisking, separates the microbes from the soil particles. The addition of this extraction powder also helps to precipitate the soil so that the microbes stay suspended as the soil precipitates to the bottom of the test tube.
Once the microbes are separated from the soil, they can be detected by spectrophotometry. However, like a microscope, a spectrophotometer is both expensive and too large to use in the field. The solution, in keeping with the goal of manufacturing a very cost-effective device, was to make it a lateral flow membrane. Almost all medical devices do a vertical flow, but a vertical flow has many technical problems. In a vertical flow, different types of membranes are put together and then a clamshell type device is used to press it down, but this pressure then has to be regulated. And Dr. Fitzpatrick, having worked with many clamshell devices, knew this method caused a great deal of seepage around the outside. A lateral flow, on the other hand, is more rapid than a vertical flow which allows the sample to be put on more rapidly than you can when you’re using a vertical flow device. The flatness of the device is important as well. Most other devices that are vertical have a rim around the area where the membrane is which is called a sample well. If you look down the well you cannot see the bottom because the well walls are casting a shadow. But microBIOMETER® is flat, therefore, a shadow does not pose a problem.
To perform the test, three drops are applied to the membrane in the test card. The microBIOMETER® membrane was carefully chosen so that it would not bind any of the common pigments you might find floating in soil. It only collects microbes on the surface of this membrane. The membrane also whisks away the liquid and traps the microbes on the surface. The color that it gives to the membrane can be compared to a grayscale, which tells you that the intensity of the color, not the color itself. The intensity of the color correlates with the quantity of microbes you have. Just like with the colorimeter or spectrophotometer, the intensity of the color is linearly related to the concentration of microbes. Dr. Fitzpatrick came up with this grayscale idea while thinking about a quilting secret. Quilters want to make sure they not only have different colors but have different intensities of color as well. Therefore, we’re not just measuring color but also measuring the intensity of the color.

 The next step in the development was to figure out how to read the test cards. In the early version of the microBIOMETER®, a red filter with a grayscale was used, turning it monochromatic. A piece of red cellophane was put over the grayscale in the sample window and the results were determined by how dark the center was. This earlier version of microBIOMETER® is still being used by customers who are non-tech users.
At this point, the test could be read visually but it lacked precision, and data storage and tracking capability. For this, it was decided a phone app was needed. One of the barriers to lab testing in developing countries is cost, but another is infrastructure. However, cell phones are ubiquitous. If an app to read the test cards and store the data was created, soil stewards all over the world would have the ability to track soil health over time and assess their management practices while making changes in real time.
The challenge to the cell phone is that cell phones have a camera and manufacturers utilize different software. Therefore, the image viewed isn’t raw and overcoming the differences between various phones becomes necessary. The microBIOMETER® does that with the monochromatic grayscale backing. This in essence “tricks” all phones to be in the same range in their software and white balance. The issue of different color temperatures was also encountered. When you’re out in the sun on a cloudy day or you’re in the shade on a sunny day that light is extremely blue. When you’re sitting in your living room and you have a 60-watt light bulb, that light is yellow/red. And if you’re at the office with a fluorescent light that light turns out to be white -where red, green, and blue are all equal. Therefore, accounting for differences not only in cell phones but in ambient lighting conditions became important as well.
This stage of test development consisted of vigorous testing and a good amount of trial and error. The process involved running around with a test card from light source to light source with five or six different phones making sure the readings were consistent. By utilizing the camera’s flash in conjunction with a monochromatic backing, the images between phones became uniform. Once the patented algorithm that compensated for differences in light color and intensity and phone software was finalized, in 2018, the microBIOMETER® was released to market.
 A few years later, in 2020, Dr. Fitzpatrick and Dr. Trexler tossed around the idea of adding another soil test to the microBIOMETER® platform; the fungal to bacterial ratio. During one of these discussions, Dr. Trexler inquired if there was a way to use size to differentiate bacteria and fungi. As a microbiologist, Dr. Fitzpatrick knew that bacteria are much smaller than fungi and therefore could be differentiated based on size. Dr. Trexler then wrote software that could detect and pick out the bacteria and fungi. It was discovered that when looking at a fungal to bacterial ratio on the microscope, a slight change in the color was evident; fungi are a very, very slightly different color than bacteria. There was a correlation between the color of the sample and the fungal to bacterial ratio that was detected microscopically, which turned out to be a groundbreaking discovery. After trying various methods for determining the fungal to bacterial ratio by color, it turned out cell phone cameras had the ability to pick up the difference. This discovery led to the fungal to bacterial ratio data being added to the microBIOMETER® app.
The following year, another exciting feature was added to the platform; Project Management (PM). A big advantage of reading results with a cell phone is that the data can be stored on the cloud. When the app was first written, there were a few different data fields for each sample. There was crop quality, crop type, soil class, and a couple other generic fields. It was soon realized that people using the test were likely more knowledgeable about what data and metrics assisted with farming. So, the app was updated to allow users to create their own fields based on their needs. This development was the release of Project Management (PM). Now, users can have as many fields of data as they want and it’s completely adjustable. Another benefit of PM is it lets users create a project and anyone on the team can upload their test results to the project. Before PM, everyone’s samples were on their own phone and in their cloud account. Now all the samples, regardless of who performed the test, are in one place and can be easily downloaded for analysis. Users can create as many projects as they want to keep trials separate from each other, but with all the data aggregated. There is one microBIOMETER® customer who currently has 20 different projects that match up with each of the properties they manage.
microBIOMETER® allows users to quickly determine if they are achieving the improvements they are looking for; track soil microbial activity over time and see how it varies with practice in order to assess what is working and what is not. With an innovative, yet inexpensive soil test like microBIOMETER®, $7 to $14 compared to much more expensive tests, growers can sample more per acre, allowing them to acquire a better understanding of their crops. With the ease of multiple sampling combined with data storage, users can view year over year and season over season results to see if their microbiology is increasing and if their soil health is increasing as a result.
 It is important that the microbiology increases because there’s an incredibly high correlation between soil biology and soil health. We know that as microbial activity increases, so does the water holding capacity of the soil. It also makes crops more resistant to excess water – which can lead to erosion. Soil microbes build soil structure, which mitigates drought as well as flooding risk because it improves the texture of the soil. Microbes make a glue-like substance which enables them to stick to the soil. This stickiness remains after the microbes die and causes the soil to become clumpy. These clumps allow the soil to hold more oxygen, as it provides more aeration. Growers can improve the amount of carbon in their soil since the stored carbon in your soil is the bodies of dead microbes. When a microBIOMETER® soil test is performed, you’re looking at a snapshot of the microbes. They’re constantly turning over and they are food for other predators in the ecosystem. But that turnover demonstrates that you have a large number of microbes and that the entire ecosystem is being fed.
When you feed the soil ecosystem – from microbes to earthworms to mammals – that’s when you achieve the healthiest soil. Many creative and innovative practices are being developed that understand that healthy soil is part of a healthy system. The start is a healthy microbial ecosystem and microBIOMETER® gives you a glimpse into that very, very quickly. There’s nothing else like it.
This article is based on the video The History and Science behind microBIOMETER®
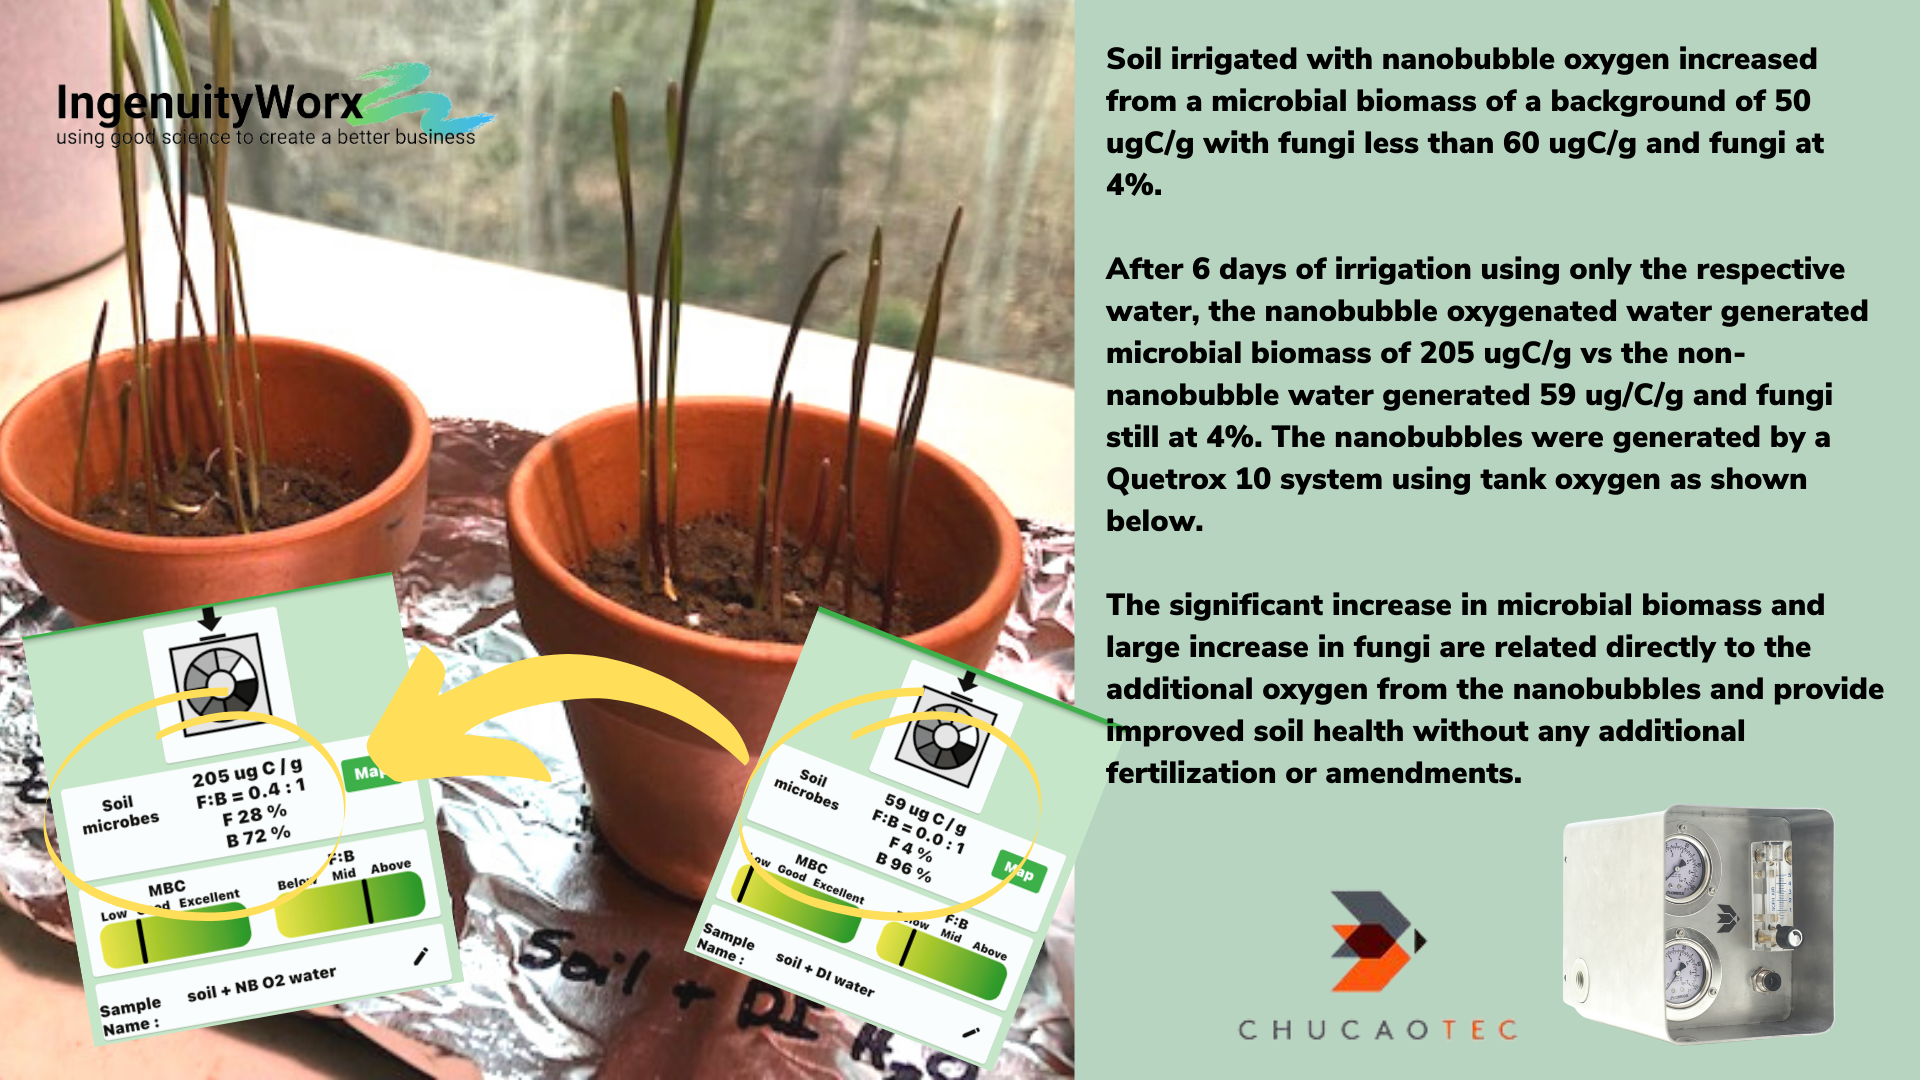
IngenuityWorx has been working to prove that the application of nanobubble oxygen as an irrigation/fertigation tool can provide low cost, easily applied plant benefits both indoors and outdoors.
It has been known for over 40 years that increased oxygen to plant roots in soil improves nutrient absorption, reduces effects of saline water or sodic soils, and increases plant growth and yields. However, traditional aeration technology prevented its use. Aerated water was limited to very short application duration and limited travel time in an irrigation line with low oxygen transfer efficiency.
The new science of nanobubbles allows us to add high dissolved oxygen concentrations, reaching 30-50 ppm, and the oxygen transfer will continue to take place for weeks. The nanobubbles don’t coalesce and break like macro bubbles, they move within the water using Brownian motion, and upon giving up all their oxygen produce small amounts of reactive oxygen species including hydrogen peroxide. This feature provides a built-in cleaning process that removes biofilm.
The microBIOMETER® analysis here shows that high dissolved oxygen in the irrigation water stimulated the microbial biomass and fungi to increase in number indicating a healthy microbiome in the soil for plant growth.
Additional work is ongoing to measure and understand the effects of the oxygenated water and microbial increases as it relates to soil carbon utilization, and its impact on carbon reserves and available nutrients. For more information, please contact bo*@***********rx.com.

University of Louisiana at Lafayette
Last semester Soil Science and Environmental Pedology students under a supervision of Dr. Anna Paltseva [annapaltseva.com] conducted a soil microbial experiment on campus of University of Louisiana at Lafayette. First, each of the group of students collected different samples. Samples were collected from lawn, vegetable containers, around tree pits, and a native plants garden. The soil samples were analyzed in accordance with the provided procedure, which is simple and fast. The microBIOMETER® app tested the samples and gave each of the readings. The readings were in microbial biomass expressed in microbial-carbon per gram of soil (ug/g) and fungal to bacteria ratio F:B, F% and B%.
The vegetable container and samples from the tree pits showed the highest range of 400 – 800 ug/g. This is due to high organic matter content. The low results from the lawns may have been due to limited microbiological diversity due to monoculture of grasses grown. The areas close to the water bodies (culvert, pond, etc.) may have been lower due to organic matter washing away over time. All the samples were predominantly rich in bacterial population over fungal.
“microBIOMETER® is a very efficient and time saving tool. It can be used by scientists, farmers, or a gardener in learning the microbial health of their soil. This testing process is also very non-invasive, and thus having a lesser negative environmental impact compared to traditional testing. One of the students said, It was pretty cool using an app to analyze soil. I want to know how it works since it all felt like magic.” – Dr. Anna Paltseva
Click here to view the student’s video.
Order a microBIOMETER® Academia Kit for soil testing in your classroom!
If you are interested in Dr. Paltseva’s research or would like to learn more about urban soils, please follow her on Instagram.

Microbial Biomass Chart